-

The Mind Waves podcast!
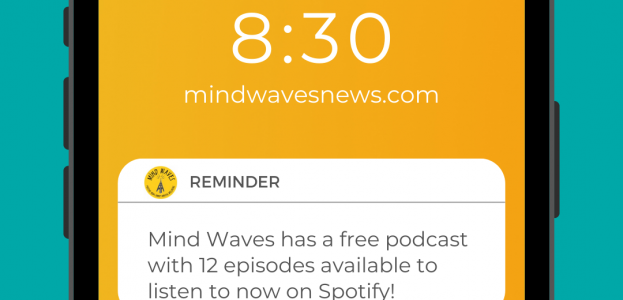
Good morning everyone and happy Monday! Just popping up to remind you that Mind Waves ...
-

Hibernation for humans: hiding away during the winter months
January 2024 has brought darkness, cold temperatures and three named storms! With Storm Henk, ...
-

Highlights from 2023 – A festive round up!
As the end of the year approaches, we thought that we’d share some of Mind ...

Mind Waves Community Jam – a free weekly music group in Glasgow
Mind Waves is a Glasgow charity that supports people to share their stories through creative approaches, empowering them to develop new skills and tend to their wellbeing. Thanks to the GCVS Glasgow Wellbeing Fund, we are now hosting weekly Community Jam sessions, a relaxed daytime open mic style event which is absolutely free to attend. […]

Head Above Water – helpful resources and encouragement from our Community Correspondent Laura
Enjoy this encouraging and inspiring post from our volunteer Community Correspondent Laura, sharing some valuable online resources which have helped her throughout her recovery journey. Just a note that the organisations or pages mentioned are not designed for dealing with crisis situations. If you require urgent help please refer to these NHS numbers and resources. We […]

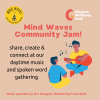
Share, create and connect at our new Mind Waves Community Jam!
Mind Waves is a Glasgow charity that supports people to share their stories through creative approaches, empowering them to develop new skills and tend to their wellbeing. Our weekly Community Jam sessions are a free relaxed daytime open mic style event held every Thursday from 11am-12.30pm at Project Ability, 103 Trongate, Glasgow. After some taster […]

Join our brand new Anti-Stigma Podcasting Team
How do money worries affect your mental health? And how can mental ill health make you poorer? Mind Waves is a Glasgow charity that supports people to build their skills and share their stories and opinions. We have been funded by the See Me Anti-Stigma Arts Fund to delivery our brand new podcasting project. We’re […]

Introducing our Creative Community Programme for 2025!
The next few months are set to be a busy and exciting month here at Mind Waves as we are launching three new community programmes! These are open to anyone living in the Greater Glasgow and Clyde area with an interest in mental health, especially around challenging stigma. All of our activities are creative, inclusive […]

The art of happiness – finding joyful purpose, writing that book and embracing your “woo” with Sam Brook of the Happiness Club!
We’ve had a glow-up!!! Yes, we are go on a brand new Mind Waves podcast! Welcome to Ripples, a podcast creating waves of connection, creativity and community for all of us navigating the ups and downs of mental health recovery. We believe that our stories of lived experience really do have a ripple effect. Catch up […]

“I have been a mermaid my entire life” – immerse yourself in the beautiful Ice Bath by Lynn Blair
A year ago, I decided to celebrate Mother’s Day by having a swim in the sea. For those who don’t know, March is the month of the year when the sea is coldest, the time lag in the earth’s temperature meaning it’s colder even than January, and although I have been a mermaid my entire […]

Then Stigma Comes Along – our new blog theme
For the next month we will be focussing on the theme of stigma on the Mind Waves blog and our social media content. This is inspired by many of the conversations that arose during Mental Health Awareness Week, with many campaigners, organisations and individuals highlighting how much still needs to be done about the stigma […]

We are Mind Waves – an introduction
Welcome to Mind Waves! Today we are simply sharing a little introduction to what we do. We are Mind Waves , a small peer-led Glasgow based charity with a big imagination and even bigger heart! We use creative arts and digital storytelling to share experiences and insights into mental health and wellbeing. Mind Waves is […]

Should we move the conversation, not just our bodies, this mental health awareness week?
A post from our Mind Waves Projects Manager, Marie. This year’s theme of movement for Mental Health Awareness Week has a focus on how people can move their bodies more for wellbeing. The hashtag “Moments of Movement” encourages people to use small pockets of time to move more. Over the years on this blog we […]

